
Trends is a forecasting tool designed to project market movements by analyzing 10 years of historical data. By leveraging our extensive database of local compensation packages, we provide reliable insights into future pay growth.
The Trends tool uses historical data to estimate future shifts. However, these projections assume past trends will repeat and do not guarantee future results. Market conditions are subject to change.
Your access to specific country data is aligned with your active subscription.
How to Run Your Analysis on the Community Website
Follow these steps to generate your compensation projections:
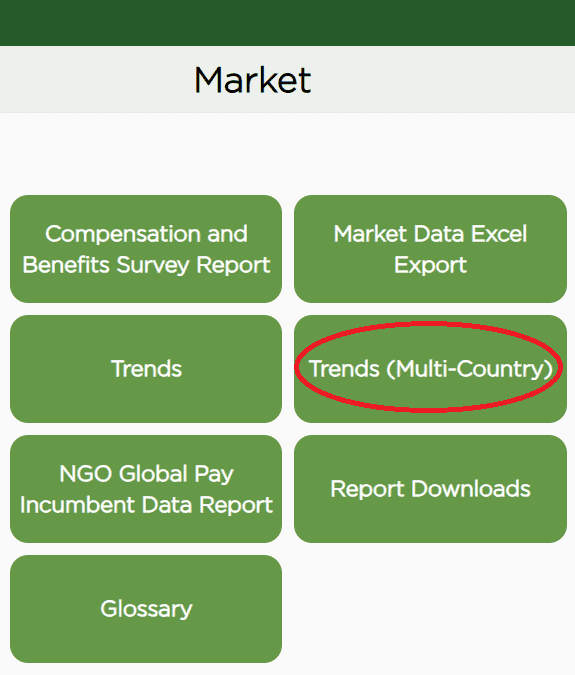
Step 1: Access the Tool
After logging into the Community website, select the Market quadrant from the dashboard and click on “Trends (Multi-Country)”

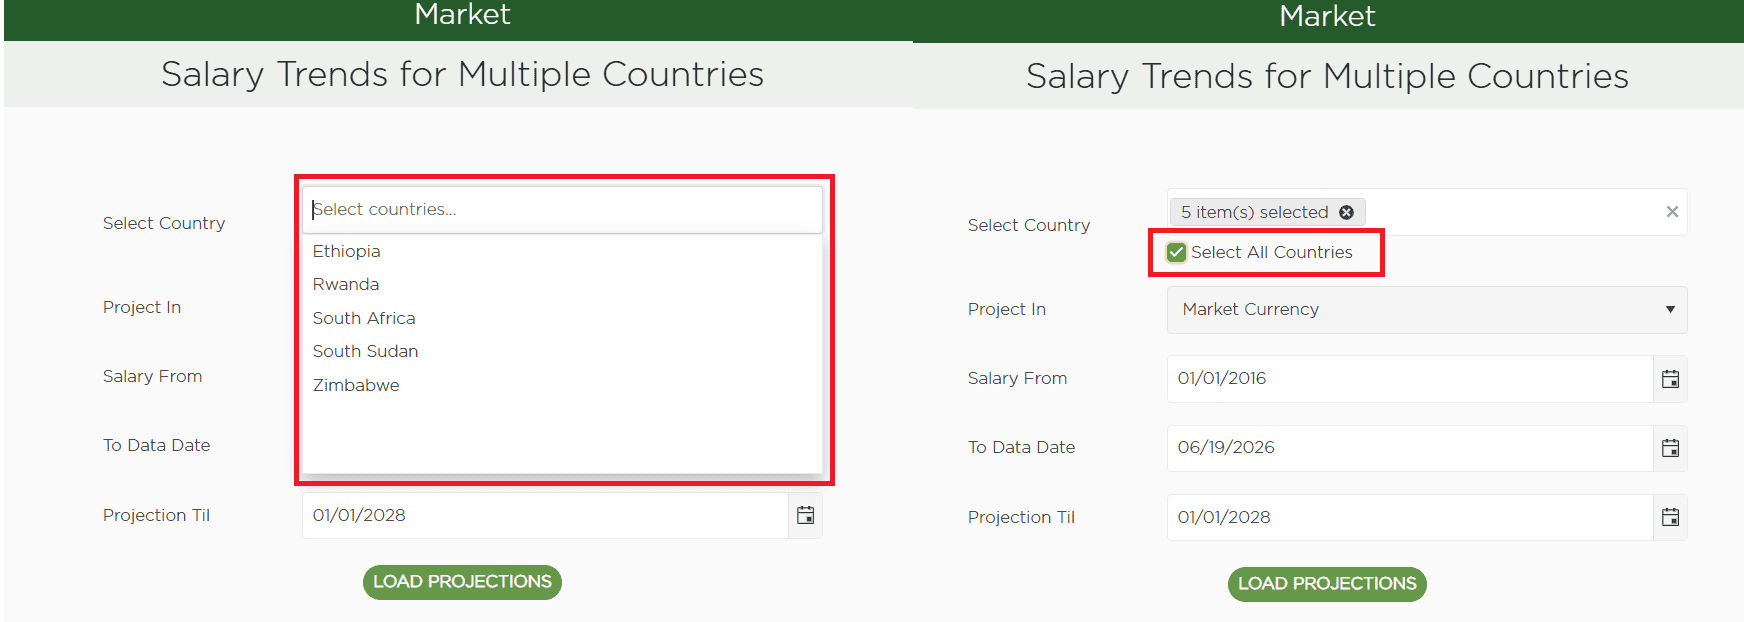
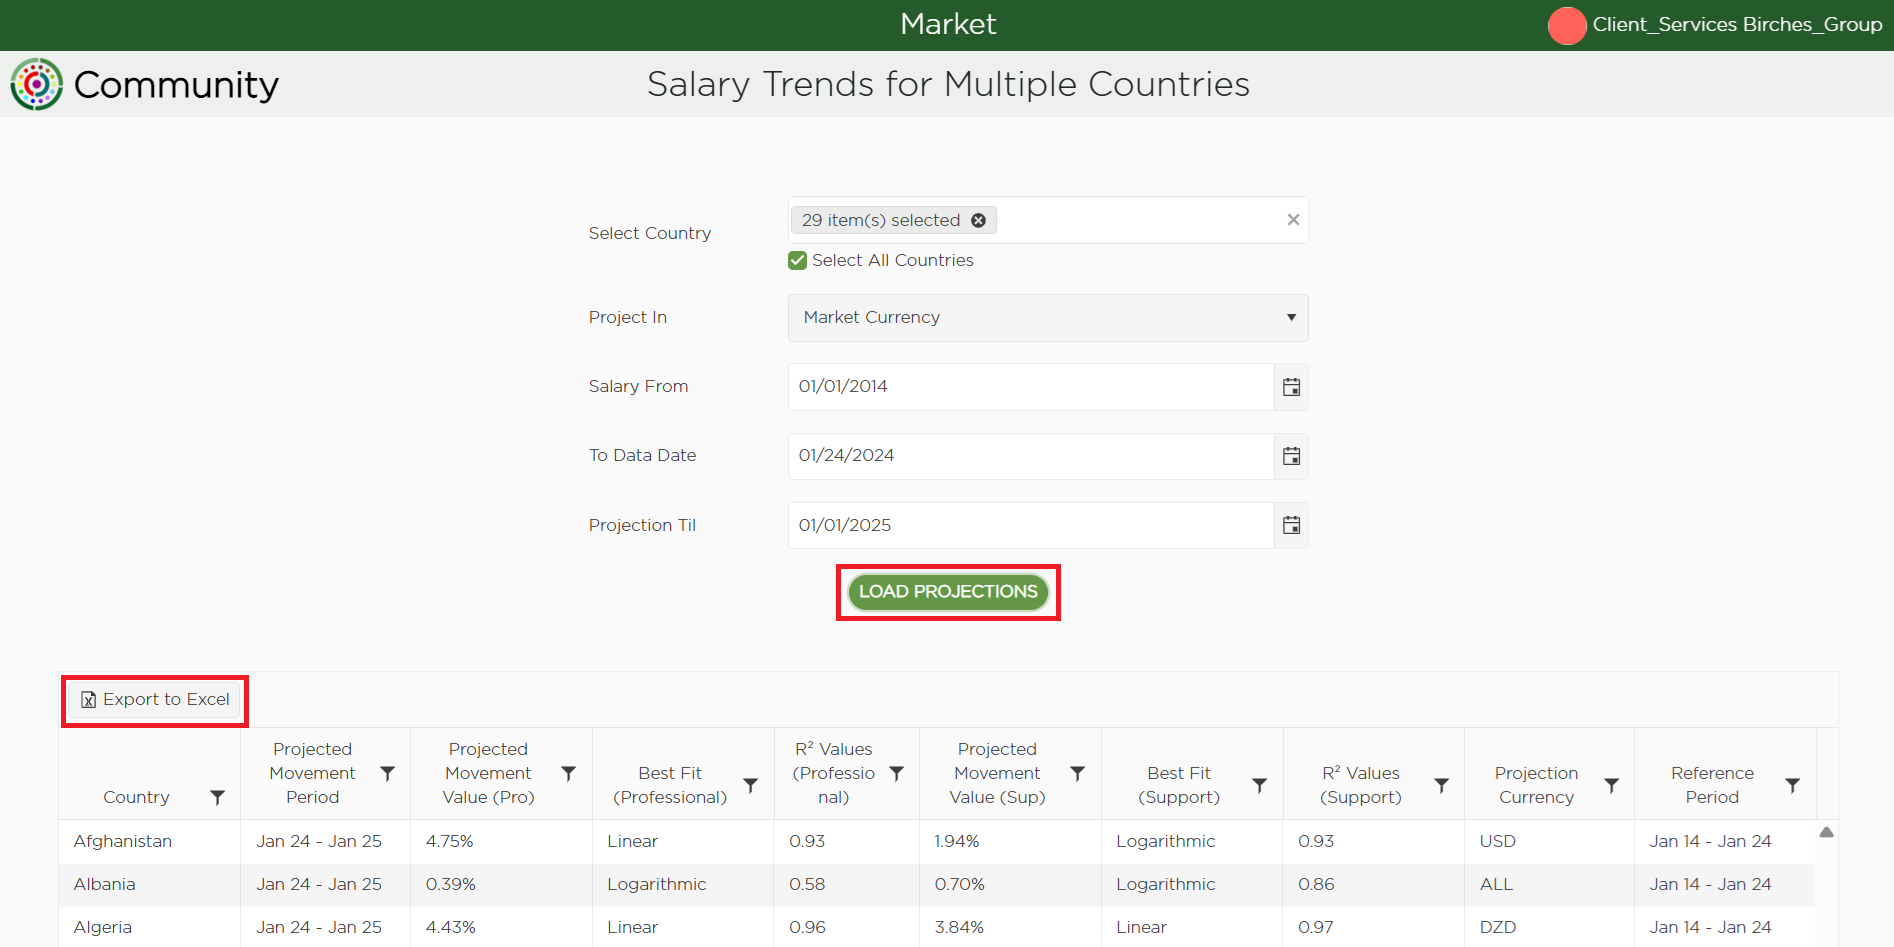
Step 2: Select Your Location
All the countries you have access to are selected by default. You may click on the dropdown menu to select or deselect the countries.
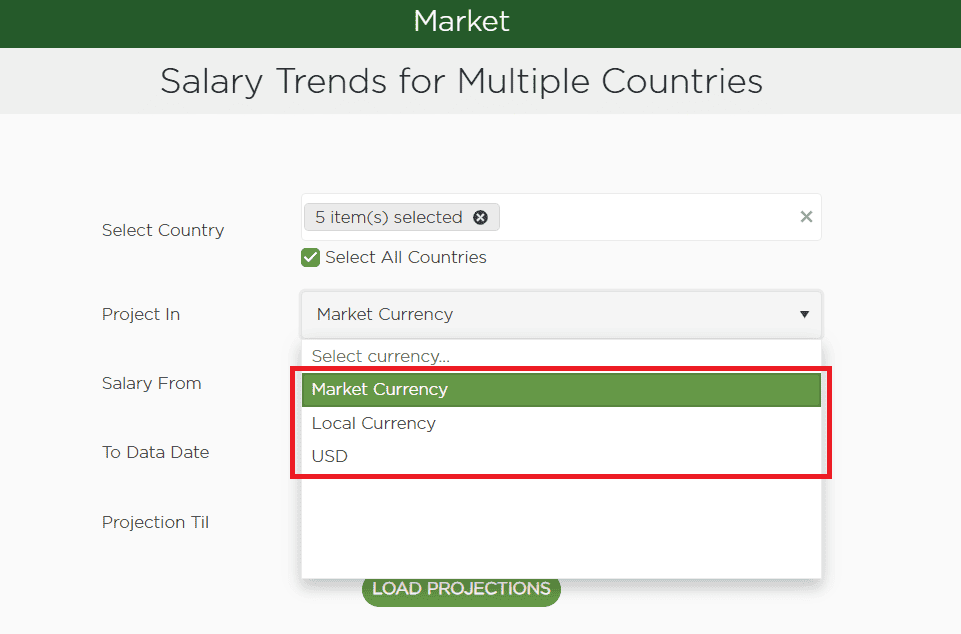
Step 3: Select Currency
You have the option to select local currency or USD. The system will automatically default to the Market Currency, which is the common local practice followed by the majority of survey participants in the specific countries.
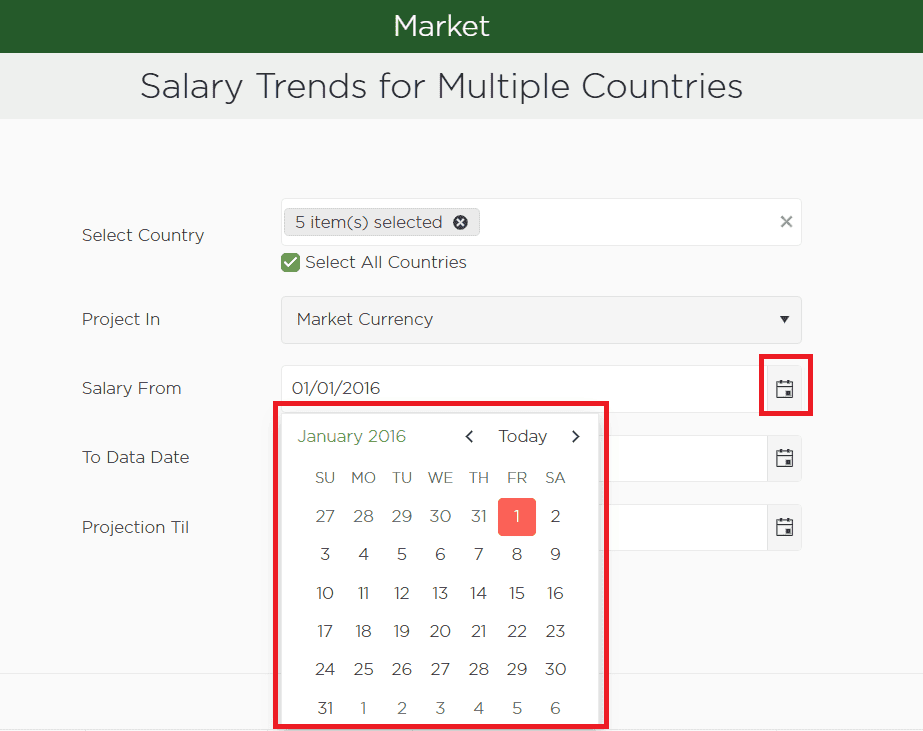
Step 4: Define the 10-Year Historical Range
Start Date: In the "Use salary from" field, select the date exactly 10 years prior to the latest publication.
End Date: Set the "To data date" to the most recent publication date available.
Step 5: Set Your Projection Timeline
Choose your desired end date in the "Projection til" field.
Note: For maximum accuracy, we recommend a projection period of no more than 18 months.
Step 6: Click on “Load Projections.” The data will be available for viewing in a table format. In the upper left corner of the data table, there is an “Export to Excel” button to save a local copy to your device.
How it works
The tool performs a Regression Analysis, comparing three specific trajectories against the historical data. It automatically selects the model with the highest R² value—the one where the projected line aligns most closely with your actual data points.
Please note that an R2 value of 0.85 and above is generally considered a strong correlation. We would not recommend using projections with R2 values less than 0.8.
Here is how those three patterns differ:
Linear - This assumes the market moves at a constant pace. If salaries have increased by roughly the same amount every year, a straight line provides the most reliable forecast.
Exponential - Used when growth is compounding. In this scenario, the market isn't just growing; it is growing faster each year, resulting in a curve that bends upward.
Logarithmic - This pattern applies to markets that saw rapid growth in the past but are now beginning to level off. The curve rises quickly at first and then starts to plateau.
Once the tool identifies which of these three mathematical stories your market is telling, it extends that specific path toward your chosen date. By selecting the model with the lowest prediction error, it transforms a decade of complex history into a logical, data-driven roadmap for your future compensation planning.
Support Staff: BG-01 – BG-07
Professional Staff: BG-08 – BG-14
Note: These projections are powered by our Multisector (MS) Survey, featuring data from consistent top employers. Consequently, Trends is only available for countries with a published MS survey and a full 10-year data history.